You will learn
With this Power BI cource you will learn how to create your own data analysis with Power BI Desktop and Power BI Cloud Service! On the course we will focus on the tool Power BI Desktop and the newest version of Power BI Cloud Service. You will learn to create data models and reporting and how to share them with your colleagues.After the course you will be able to handle these tasks:
- Create data models with Power BI Desktop
- Use Power Query to combine data from different sources
- Create calculated columns and measures
- Create reports
- Create dashboards
- Share the reports and dashboards
You get
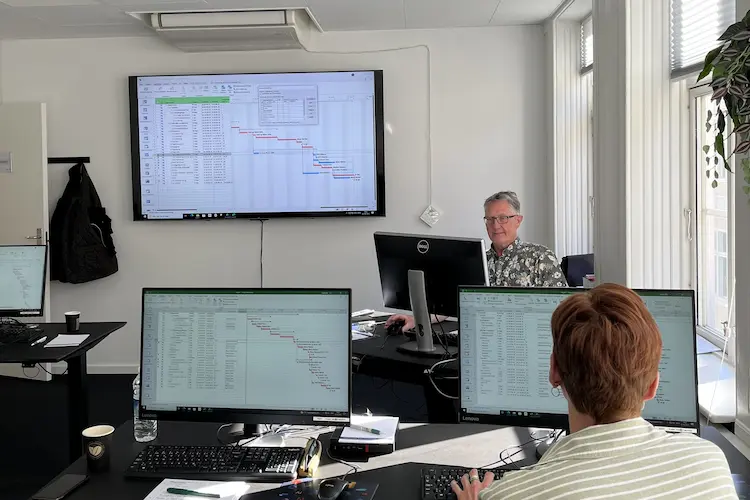
During the course- Teaching by the most experienced instructor team in our cozy and fully updated classrooms located in the center of Copenhagen.
- A course that consists of a both theory and practical exercises. We know the importance of having practical exercises and hands-on is always in focus during the courses.
- A course material you can use as an encyclopedia after the course and downloads of course exercises.
- All meals, which includes breakfast, fresh coffee, tea, fruit, soft drinks, lunch in an Italian restaurant on Gråbrødretorv, cake, candy and off cause Wi-Fi to your devices.
- A course certificate as a proof of your new skills.
After the course
- Access to our free hotline service, which means that you up to a year after the completing of the course can contact us if you have questions regarding subjects from the course.
- We have a unique satisfaction guarantee in order to ensure you the complete benefit from the course.
Get the best benefit from the course
This Power BI kursus is a part of 4D's unique collection of English conducted courses and is designed for business analytics, controllers or similar rolles, that wants to start working with Self- Service Business Intelligence.It is expected that you are familiar with handling data, relations and general BI principles e.g. dashboards.
Course Details
Module 1 – Introduction to Power BI
The aim of this module is to give an overview of Power BI concepts, tools and Self-Service Business Intelligence.
The following will be covered:
The following will be covered:
- Introduction to Self-Service Business Intelligence
- What is Power BI Desktop?
- What is Power BI Cloud Service?
Module 2 – Introduction to Power BI Desktop
The aim of this module is to introduce you to the stand-alone tool Power BI Desktop, that comes as freeware independent of e.g. Office.
The following will be covered:
The following will be covered:
- Introducing Power BI Desktop
- The different parts of Power BI Desktop
Module 3 – Creating a Datamodel
You will learn how to create a Data model with relations, hierarchies and finetuning.
The following will be covered:
The following will be covered:
- Introduction to Data models
- Relations
- Finetuning the Data model
Module 4 – DAX
The module will introduce you to the expression language DAX. You’ll learn how to create different calculations inside the data model. Calculations based on time periods are presented separately.
The following will be covered:
The following will be covered:
- Calculated columns
- Measures
- Time Intelligence
Module 5 – The ETL proces
In this module the ETL tool Power Query is presented. You will learn to transform data from your data sources before loading them to the Data model. Making the data model perform better and creating a more intuitive model for the end user.
The following will be covered:
The following will be covered:
- The Power Query editor
- Queries
- Transforming data
- M-language
Module 6 – Reporting
This module will introduce you to different aspects of the reporting tool, so you can create informative reports using different visuals such as charts, maps and slicers. Also, a lot of interactive opportunities are presented.
The following will be covered:
- Charts, maps and slicers
- Interactive tools
- Bookmarks
Module 7 – The Power BI cloud service
The aim of the module is to learn how the cloud service powerbi.com is structured, how you can share your reports- and dashboards and different technical aspects.
The following will be covered:
The following will be covered:
- Publishing to powerbi.com
- Report options
- Dashboards
- Sharing dashboards and reports
- Automatically refresh
- Record level security
- Downloads
Tilmeld kurset
Har du spørgsmål sidder vi klar til at hjælpe på vores live chat eller via kontaktsiden
Status
Startdato
Hvad siger vores kunder om os?
1242
Evalueringer seneste år
4,8
Gns. Rating ud af 5
Siden 1990 har 4D Academy hjulpet virksomheder og specialister med at omsætte viden til målbare resultater. Vores kursister belønner os med en gennemsnitlig rating på 4,8 ud af 5 på Trustpilot, Google og Facebook, og det gør os stolte.
Se hvorfor både nye og erfarne fagfolk vælger os, når de vil løfte deres kompetencer.
Hold dig opdateret med vores nyhedsbrev
Her bor vi
Kursuscentre
København (Hovedkontor)
Læderstræde 22, 2. sal, 1201 København K
Læderstræde 22, 2. sal, 1201 København K
Aarhus
Tueager 5, 8200 Aarhus
Tueager 5, 8200 Aarhus
Odense
Ørbækvej 350, 5220 Odense
Ørbækvej 350, 5220 Odense
Åbningstider
Mandag: 08.00 - 16.00
Tirsdag: 08.00 - 16.00
Onsdag: 08.00 - 16.00
Torsdag: 08.00 - 16.00
Fredag: 08.00 - 16.00
Tirsdag: 08.00 - 16.00
Onsdag: 08.00 - 16.00
Torsdag: 08.00 - 16.00
Fredag: 08.00 - 16.00


